
CalcDocs Gets Even Better: Interactive Tolerance Propagation in the Distribution Webview in VS Code
A technical overview of CalcDocs’ distribution-based uncertainty propagation engine integrated into the VS Code webview.

CalcDocs introduces an updated distribution-based uncertainty propagation engine integrated directly into its VS Code webview. The goal is to support engineers working with formulas and derived quantities where input variability is not negligible, and where spreadsheet-based workflows become a bottleneck in reviewability, traceability, and iteration speed.
The focus of this update is not only interactivity, but coherence between model, code, and documentation.
Problem context
In embedded and low-level engineering, calculations are rarely purely deterministic. Typical workflows involve:
nominal values with tolerances
measured parameters with noise
datasheet-derived ranges
assumptions that evolve during design
Despite this, most workflows still rely on:
spreadsheets disconnected from source control
scripts detached from documentation
manual propagation of uncertainty
This creates friction in:
reviewability
reproducibility
change tracking
design validation over time
CalcDocs addresses this by embedding both formula definition and uncertainty propagation into a single text-based model inside the editor.
Model overview
CalcDocs represents a system as:
a set of scalar or derived variables
optional input distributions per variable
a deterministic formula graph
a propagation engine producing output distributions
Each input variable can optionally be associated with a distribution (e.g. uniform, normal, bounded empirical models depending on configuration).
The system evaluates the full graph and produces an output distribution rather than a single scalar value.
Propagation engine
The current implementation uses a Monte Carlo-based propagation model.
At a high level:
Input variables are sampled according to their assigned distributions
The formula graph is evaluated for each sample set
Output samples are aggregated into a distribution
Summary statistics and histogram representation are computed for visualization
This approach is chosen for its:
robustness against non-linear transformations
simplicity of extension to arbitrary formula graphs
predictable behavior across heterogeneous inputs
Trade-offs are explicitly accepted in favor of correctness over closed-form approximations.
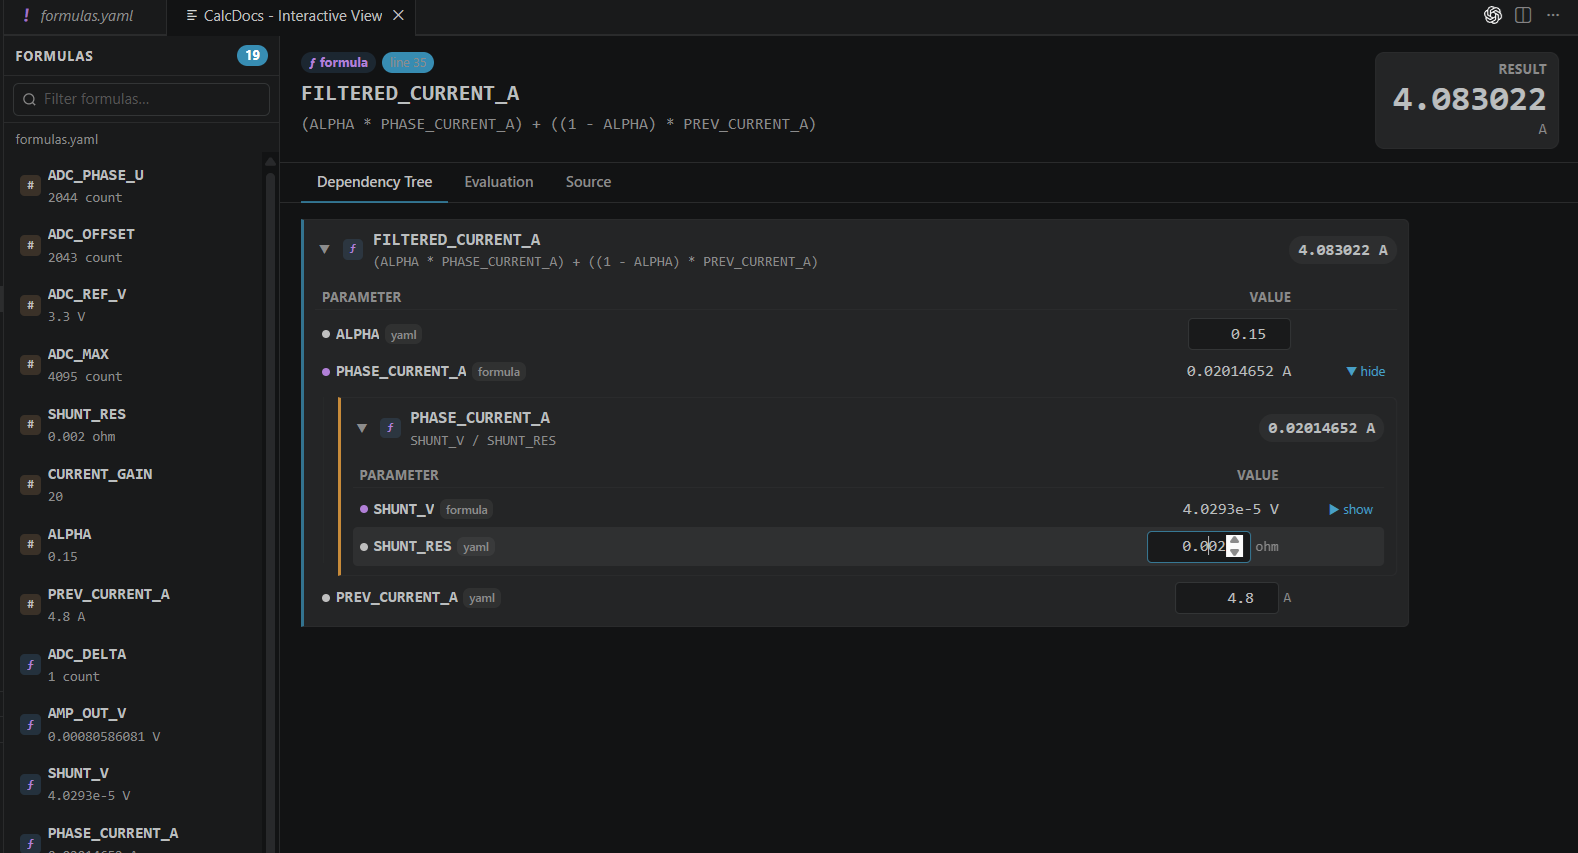
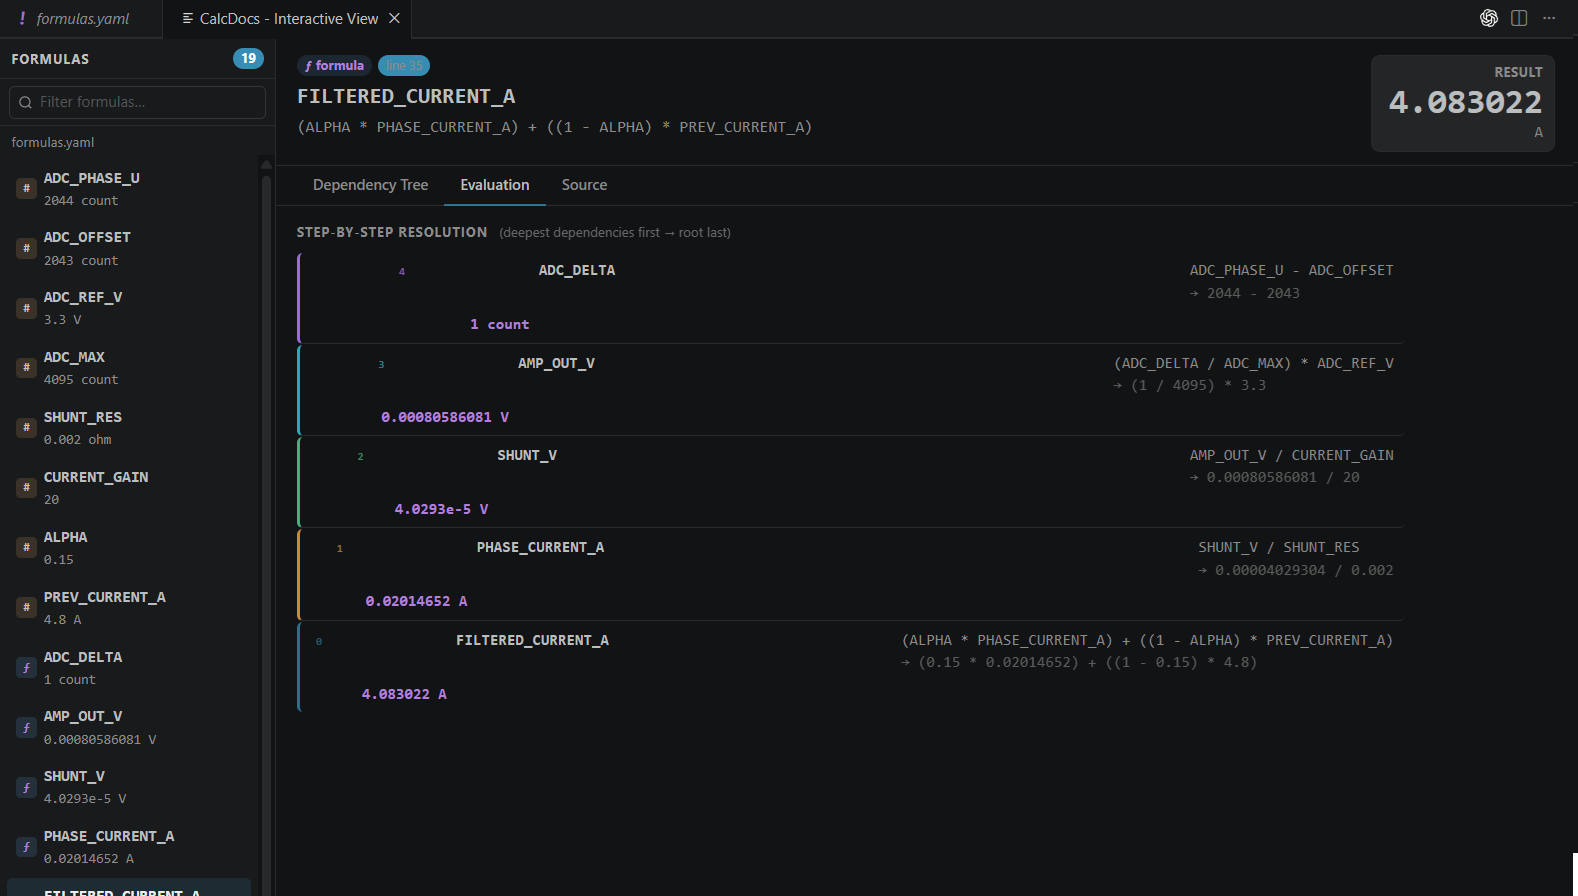
Webview integration
The VS Code webview provides a live view of:
formula structure
dependency graph
input distribution configuration
output distribution histogram
Changes to inputs or formulas trigger recomputation of the propagation model.
Input distribution model
Each input variable may be defined as:
deterministic constant
bounded uncertainty (e.g. min/max range)
probabilistic distribution (configurable per variable)
The intent is to make uncertainty explicit rather than implicit, and to keep assumptions part of the same version-controlled artifact as the formula itself.
This enables:
review of assumptions in code review workflows
traceability of design decisions
consistent propagation across iterations
Output representation
Outputs are represented as full distributions rather than point estimates.
The webview exposes:
histogram view (configurable binning, default 16 bins)
statistical summary (mean, variance, percentiles depending on configuration)
sensitivity indication via input variation impact
Workflow integration
A typical workflow becomes:
Define formula in CalcDocs syntax
Assign input distributions where uncertainty matters
Inspect propagated output distribution
Iterate assumptions directly in the same model
Because the entire model is text-based, it integrates naturally with:
git versioning
code review processes
diff-based review of assumptions
documentation pipelines
Design rationale
The system is intentionally constrained to remain:
deterministic at the model level (same seed/config → same result)
fully declarative (no hidden runtime state in formulas)
editor-native (no external execution context required)
This is particularly relevant in embedded workflows where reproducibility and auditability are often more important than raw performance.
Performance considerations
Monte Carlo propagation introduces computational cost proportional to:
O(N × G)
Where:
N = number of samples
G = number of nodes in the formula graph
To keep the UI responsive, recomputation is designed to be incremental where possible, with caching of intermediate evaluations when only parts of the graph change.
Use in embedded contexts
CalcDocs is particularly suited to:
tolerance stack-up analysis
sensor calibration models
analog front-end estimation
derived firmware constants validation
hardware/software expectation alignment
The key value is keeping the same calculation model shared between hardware design assumptions and firmware-level usage.
Iterative updates
The system is designed for frequent iteration of both formulas and assumptions. Any change in input distributions or structure triggers a recomputation of the propagation model, ensuring that documentation remains synchronized with the current state of the design.
Documentation and model specification
Documentation and model specification
CalcDocs separates the engineering workflow into three conceptual layers:
formula definition (deterministic graph) uncertainty modeling (input distributions and tolerances) visualization and exploration (interactive webview)
Each layer is documented in detail in the following technical references:
1. Tolerance and range semantics
This document defines how CalcDocs interprets deterministic bounds and engineering tolerances, including:
min/max constraint propagation rules interpretation of ± tolerances relationship between hard bounds and probabilistic models consistency rules across chained expressions
👉 This is the foundational layer for non-probabilistic uncertainty representation
Tolerance and Ranges (CalcDocs Docs)
2. Probabilistic modeling guide
This section formalizes how stochastic uncertainty is represented and propagated:
supported distribution families (e.g. normal, uniform, empirical) sampling semantics used in Monte Carlo propagation assumptions on independence between variables handling of correlated inputs (if applicable in future extensions) mapping between engineering intuition and statistical representation
👉 This is the core definition of the Monte Carlo uncertainty model used by CalcDocs
Probabilistic Modeling Guide (CalcDocs Docs)
3. Interactive formula viewer architecture
This document describes the runtime behavior of the system:
dependency graph construction incremental recomputation strategy webview update model (diff-based vs full recompute) caching strategy for sampled evaluations responsiveness constraints in VS Code extension context
👉 This is the implementation layer connecting model → UI
Interactive Formula Viewer (CalcDocs Docs)
Conclusion
CalcDocs extends formula documentation with an explicit uncertainty model embedded directly in the development workflow.
The main design choice is to treat uncertainty not as post-processing, but as a first-class element of the calculation graph.
This makes it suitable for engineering environments where:
assumptions evolve continuously
traceability matters
and reproducibility is required across long-lived projects
